Autonomous Sentinels.
Zero Paging Tricks. Honest Licensing.
RamReaper finds what is actually holding your system memory—from runaway headless runtimes to leaking kernel pool tags—and ends the actual culprit.

 01. The Crew at a Glance · Handled by The Whole Crew
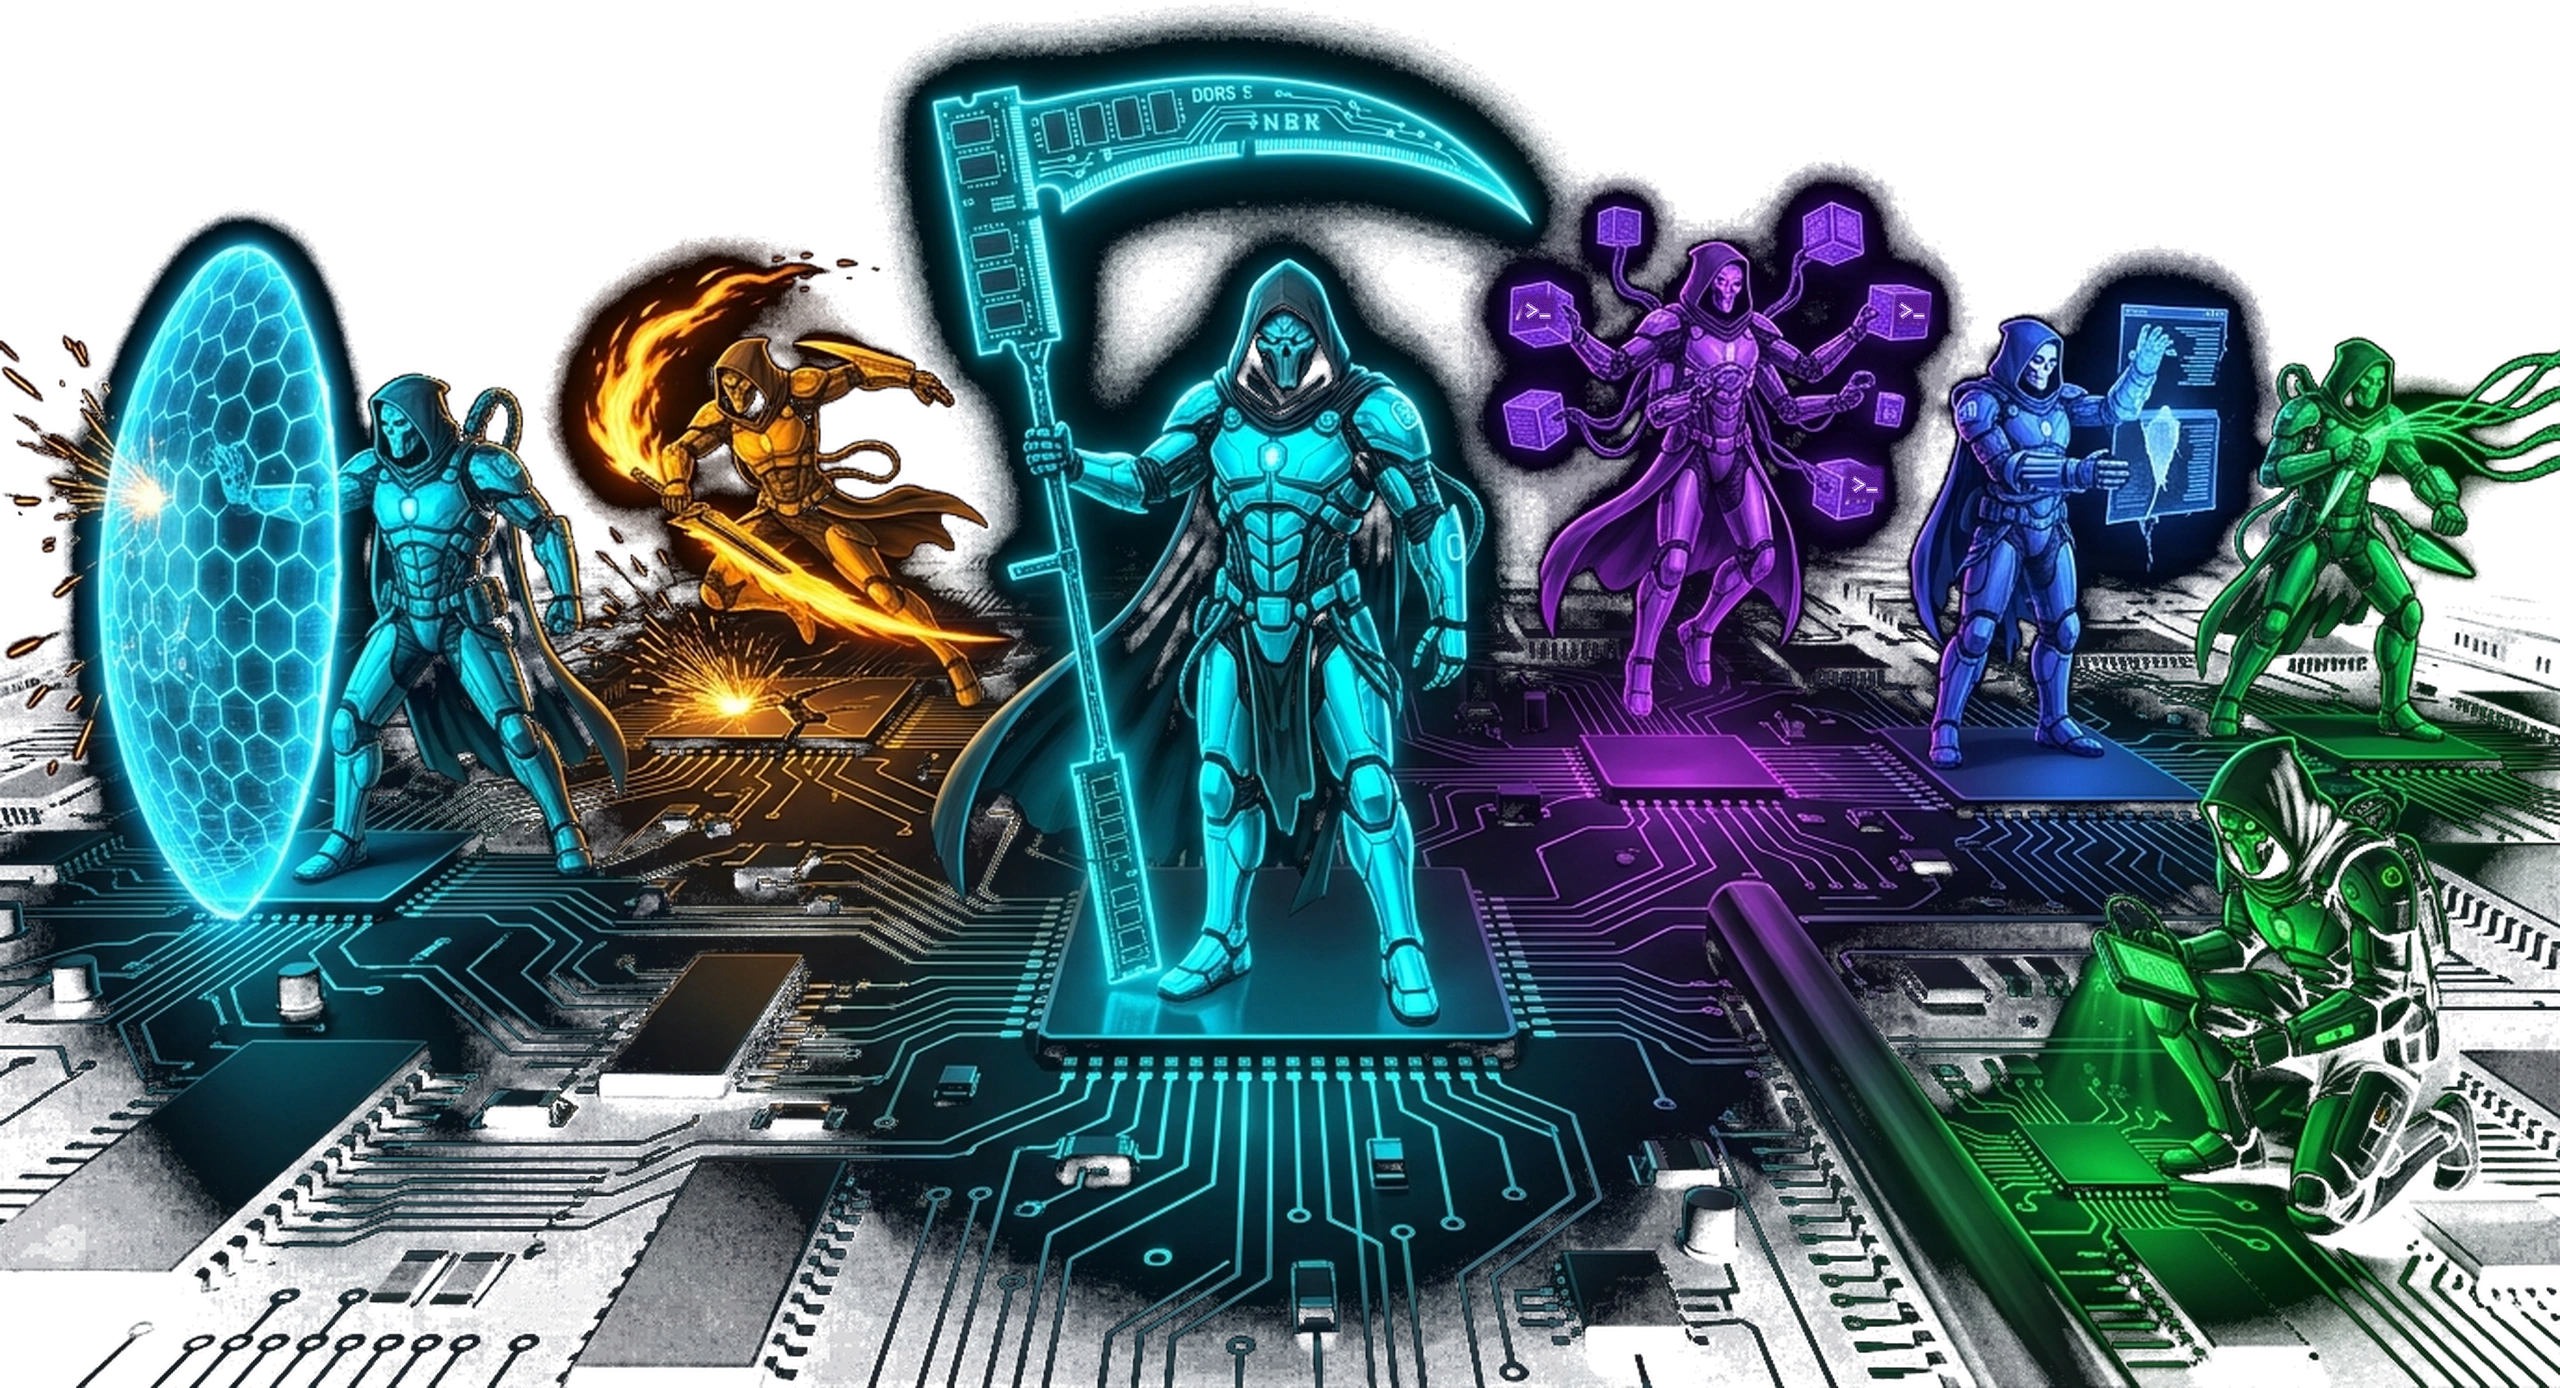
Seven Dedicated Sentinels. One Unified Engine.
Seven specialists. One Windows dashboard. Review processes, inspect occupied ports, follow memory growth, and investigate the causes of a slow workstation.
The Sentinel
Trace process ancestry and review candidates left behind by your workflow.
The Interceptor
Identify localhost listeners and review the processes holding your development ports.
The Spectre
Local AI memory, Ollama workflows, and cache management: the Spectre's specialty.
The Resurrector
Restart Explorer and investigate ghost-window candidates with owner details.
The Commit Hunter
Track private commit growth and review diagnostic findings in the Activity log.
The Kernel Warden
Inspect pool tags and candidate driver matches to guide your investigation.
 02. Kernel Leak Detector · Handled by The Kernel Warden
Task Manager can't see it.
RamReaper can.
When Windows RAM climbs to 99% with all process rows showing normal usage, the culprit lives inside the Windows kernel nonpaged pool. Task Manager hides nonpaged pool tags completely.
Inspect kernel pool activity without installing a driver. RamReaper connects pool tags with candidate driver files to help you narrow your investigation. Candidate matches are leads to review alongside other diagnostics.
Read the 62.8 GB hidden-memory case study →
 03. Transparency · Handled by The Crew
Why It Was Flagged: Zero Mystery Kills.
Understand the reason behind a finding. Scan results and diagnostic logs put the process, evidence, and next decision in front of you.
Orphaned Child Process
Parent editor (Code.exe / Cursor.exe) terminated or crashed; child server remains running headless in background.
Abandoned Dev Server
Review inactivity alongside connection history and process ancestry before choosing an action.
Runaway Private Commit
Private commit growth measured through PSAPI deltas. Sustained growth is a diagnostic signal and may also reflect legitimate work.
Trapped Port Socket
Socket held on development port (:3000, :5173, :8188) with no active clients, blocking subsequent launches.
 04. Rigid Safety Guard Rails · Handled by The Crew
What RamReaper Will Never Touch.
Designed specifically for software engineers and power users who cannot afford broken state or sudden crash resets:
- ✓ Windows Core Components: Hardcoded process protections for
csrss.exe,lsass.exe,smss.exe, and critical shell services. - ✓ Active Shells with Running Jobs: Review running work and process ownership before stopping a terminal.
- ✓ Review Before Acting: Check each candidate against your own applications, background jobs, and workflow.
- ✓ System Configuration: Investigate kernel pool activity while keeping driver configuration under your control.
- ✓ Safe System Changes: Follow vendor guidance and create a restore point before changing Windows driver settings.
 06. Activity Audit Log · Handled by The Commit Hunter
Follow the Evidence in Your Activity Log.
The development app records Commit Hunter diagnostic findings in its local Activity log. This logger does not terminate processes or trigger cleanup.
A complete persistent action history, reclaimed-memory accounting and applicable undo controls remain roadmap goals. Ending a process cannot restore unsaved work.
 07. Port & Socket Sentry · Handled by The Interceptor
EADDRINUSE :3000?
Not anymore.
When Node, Bun, Vite, Python or ComfyUI crash or exit uncleanly, they often leave orphan TCP listeners holding your favorite development ports (3000, 5173, 8000, 8080, 8188, 11434).
See which process owns a listening port, review its connections, and confirm a selected process action with identity checks.

 08. AI Workstation Curation · Handled by The Spectre
Ollama VRAM Unload & Cache Quota Guard.
Designed for local AI engineers using Ollama, Hugging Face, PyTorch, and ComfyUI:
- ✓ Local AI Memory: The Spectre focuses on model retention and Ollama workflows.
- ✓ Dev Cache Guard: A Crew specialty for the caches that grow alongside local AI and development work.
- ✓ ComfyUI Workers: Review process ancestry when local AI tools leave background workers behind.

 09. Shell Mechanic · Handled by The Resurrector
Refresh Desktop: Manual Windows Shell Restart.
Desktop stuttering, sluggish multi-monitor docking, or taskbar unresponsive after hours of heavy GPU workload?
Restart Explorer from the dashboard when the Windows shell needs attention. Review Ghost Window Finder results for owner details and diagnostic reasons. Save work before restarting the shell.
 10. Ghost Window Finder · Handled by The Resurrector
Investigate Invisible Window Candidates.
Find candidate transparent windows with owner PIDs and diagnostic reasons. Protected system, shell, input, and foreground windows are excluded to keep the review focused.
 11. Stale Shell Cleanup · Handled by The Sentinel
Clean Dead Terminals from Closed IDEs.
Follow process ancestry when an IDE or terminal leaves background shells behind. Review the owner and running work before deciding what to stop.
 12. Night Shift · Handled by The Night Watchman
3:00 AM Deep Clean While Your PC Is Locked.
Night Shift brings the Night Watchman's quiet-hours focus to the Crew: maintenance around your schedule, with a clear view of the next work session.
- ✓ Locked & Idle Trigger: Activates only when your PC is locked with zero user activity for over 30 minutes.
- ✓ Compiler Artifact Scrubber: Prunes stale temporary objects left behind by rustc, clang, and npm.
- ✓ Morning Report: Leaves an unobtrusive system tray digest showing memory reclaimed overnight.
Tray access, findings & desktop refresh
Lives in your tray
Open the dashboard from the Windows notification area. Closing it releases the dashboard window while optional Commit Hunter logging retains diagnostic history.
Findings you can review
Check process details and the reason behind each finding in the dashboard before choosing an action.
Refresh desktop
Restart Explorer from the dashboard when the Windows shell needs attention. Save your work first.
13. Built for Developers · Handled by The CrewCLI Diagnostics, JSON Output, & Global Hotkeys.
Integrate RamReaper into your developer toolchain with scriptable commands:
Terminal-based scanner reporting orphaned child PIDs, trapped TCP ports, and kernel nonpaged pool tag rankings.
$ ramreaper scan --orphans
[!] Found: python.exe (PID 9412) parent dead
[!] Port 5173 held by node.exe (0 sockets)
Autonomous sweep command with structured JSON output for integration into CI/CD build scripts and PowerShell automation.
$ ramreaper sweep --json
{"reaped_mb": 4210, "ports_freed": [3000]}
Trigger an instant sweep or open the tray HUD anywhere using Ctrl + Alt + Shift + R (fully rebindable).
Config stored in %APPDATA%\RamReaper\config.json
Pay once. Own it forever.
Choose Free for hands-on diagnostics or explore Crew for the complete seven-Reaper vision. Keep your workflow local.
RAMREAPER · FREE
Everything you need to find and fix a slowdown yourself.
- ✓ Unlimited scans: processes, orphaned runtimes, open ports
- ✓ Kernel Pool view with tags and candidate drivers
- ✓ Confirmed termination of a selected process
- ✓ Windows Explorer restart (no DWM termination)
- ✓ Ghost Window Finder with owner details and diagnostic reasons
- ✓ Temp file clean-up
- ✓ Tray icon; live memory gauge upcoming

RAMREAPER · CREW
Seven specialists for your Windows workflow. One Crew.
- ✓ Everything in Free
- ✓ All reapers running automatically in the background
- ✓ Alerts the moment a leak starts climbing, kernel leaks included
- ✓ Auto-reap idle dev servers and AI runtimes you've approved
- ✓ Cache guard for Hugging Face, PyTorch and pip, with your limit
- ✓ Night Shift: scheduled deep clean while you're away
- ✓ Global hotkey Ctrl+Alt+Shift+R and command line
ramreaper sweep - ✓ Offline license key
16. Competitive Analysis · Handled by The CrewHonest Comparison With Industry Utilities.
Compare approaches to Windows memory management. RamReaper focuses on process context, diagnostic evidence, and actions you can review.
| Capability / Approach | RamReaper | Process Lasso | Mem Reduct | MS PC Manager | RAMMap + poolmon |
|---|---|---|---|---|---|
| Core Mechanism | Ends actual leak culprits & orphans with your OK | CPU priority, core affinity & process rules | Forces Windows working-set paging to disk | Trims temp caches & working sets | Manual diagnostic analysis |
| Kernel Pool Tag Leak Scan | Pool tags and candidate driver matches | ✗ No | ✗ No | ✗ No | ✓ Diagnostic only (expert manual CLI) |
| Orphan Process Hunter (Dead Parent PID) | ✓ Yes (Win32 Toolhelp32 audit) | Manual rule creation required | ✗ No | ✗ No | ✗ No |
| Port Sentry (EADDRINUSE 3000/5173) | ✓ Yes (Win32 iphlpapi.dll table) | ✗ No | ✗ No | ✗ No | ✗ No |
| Causes Working-Set Stutter | ✗ No (Never touches paging) | ✗ No | Frequent (forces app paging thrashing) | Frequent (trims active sets) | Diagnostic analysis |
| AI & Dev Cache Guard | Local AI workflows | ✗ No | ✗ No | Temp file clean only | ✗ No |
| Telemetry & Offline Operation | 100% Offline (Zero pings, Ed25519 offline auth) | Minimal update checks | 100% Offline (Open source) | Microsoft diagnostic telemetry | 100% Offline (Microsoft Sysinternals) |
| Download Size (Different Package Types) | 1.2 MB installer | ~15 MB | ~1.5 MB | ~50+ MB | ~3 MB |
Engineering Teardown · Handled by The CrewWhy “RAM cleaners” are snake oil.
Forcing your apps into the pagefile so Task Manager shows a smaller number is snake oil. It looks great for ten seconds, then everything stutters while Windows pulls pages back off your drive. RamReaper doesn't touch paging. It finds what is actually holding your memory (a dead dev server, an orphaned Python process, a leaking driver) and lets you end it cleanly.
Follow the owner
A smaller working-set number does not explain where memory went. Start with process ancestry, port ownership, and sustained private commit growth.
Look below the process list
Kernel pool tags and candidate driver matches add context when ordinary application totals do not explain system memory use.
Review the next action
Use the diagnostic evidence to choose a targeted action. Check the process and save your work before stopping it.
Questions about Windows, privacy or licensing? Read the FAQs